
Hej
Läste att Yingluck har tappat 4% i förtroende hos det Thailändska folket ifrån 38.6% i sep. 2011, till 34.7% i jan. 2012 och det är ju inte bra, men kanske inte oväntat efter alla problem vid översvämmningarna.
Men oppositionens Abhisit hade bara 12.9% av befolkningen förtroende för i sep. 2011 och nu är det lite bättre med 14.2% i Jan. 2012, så Yingluck har fortfarande en betryggande ledning på ca 20% när det gäller förtroendet ifrån folket.
Samtidigt är det ju så att ca 50% inte har förtroende för någon av dom.
Mvh Isan Lover
ABAC Poll: Yingluck supports drops, but maintains 20 point lead over Abhisit; 50% no confidence in either
By Bangkok Pundit Feb 06, 2012 9:00AM UTC
Comments Off
It is a few weeks old, but last month ABAC had a poll that surveyed 4,689 people between December 1, 2011 and January 18, 2012 in 17 provinces, namely Bangkok, Pathum Thani, Samut Prakarn, Chachoensao, Subhan Buri, Nan, Chiang Rai, Chiang Mai, Amnat Charoen, Srisaket, Loei, Sakon Nakorn, Udon Thani, Nakhon Ratachasima, Surat Thani, Yala, and Songkhla. Survey data methodology is at the end.*
The poll solely focused on the comparison in the confidence that people had in Yingluck or Abhisit. The first graph shows the difference between the same question asked in September:
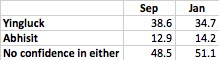
BP: In some ways, it is unsurprising that confidence in Yingluck has dropped. This is also reflected in the monthly Suan Dusit political index where Yingluck’s rating dropped significantly after the floods although she has gradually recovered some of that support. Then again, Yingluck still leads Abhisit by just over 20 points and Abhisit has only partially gained (i.e those who have lost confidence in Yingluck are not necessarily going to Abhisit). It is hard to gauge those who have no confidence in either and who they would have confidence. BP is disappointed that the pollster didn’t asked those who had no confidence in either on who they had confidence in. Was it current politicians? Politicians including those currently banned? Or non-political figures? For now, we won’t know.
Below is the breakdown:
Gender

BP: Not too much difference really. Abhisit used to do better with women than man and Yingluck is doing the reverse although the gap is not significant.
Age

BP: BP has noticed for a while that the Democrats typically do better with those aged 20-39 particularly those aged 20-29. You could say they are more middle class than the 40+ group who Yingluck does much better with.
Education

BP: Nothing too surprising here. Yingluck’s support falls for those with degrees whereas Abhisit increases. Nevertheless, Yingluck still does better even with those who hold advanced degrees.
Occupation

BP: Abhisit does better than his average and Yingluck does worse than hers for traders/self-employed and students whereas it is the opposite for farmers/contractors and spouses at home or those retired. Again, this is a fairly consistent trend for Abhisit/Democrats compared with the pro-Thaksin party/leader of such party.
Region

BP: The North and Bangkok are the most reflective of the entire country. Central region a little bit less so. Then, Yingluck dominates in the Northeast whereas Abhisit does much better in the South although Democrats would be disappointed Abhisit doesn’t poll above 50 or above ‘no confidence in either’ (which Yingluck does in the Northeast)
Urban vs Rural

BP: Again, not surprising.
*Survey data methodology:
Gender:
Males 48.7%
Females 51.3%
Age:
Under 20, 7.9%
20-29, 21.4%
30-39, 26.3%
40-49, 25.0%
50+, 19.4%
Education:
Less than Bachelor’s, 82.5%
Bachelor’s degree, 15.2%
More than Bachelor’s degree, 2.3%
Occupation:
34.4% are farmers/contractors,
29.4% are traders/self-employed,
9.6% work for private enterprises,
7.8% are civil servants/state enterprise employees,
5.6% are housewives/househusbands/retired,
6.4% are students, and
3.3% didn’t specify a job/unemployed.